Analysis and chart done by Claude Opus (1m) on August 27th, 2026.
A year of AI spend, and 42% of CEOs report that nothing moved: costs flat, revenue flat. Twelve percent got both benefits at once. Thirteen percent came out worse.
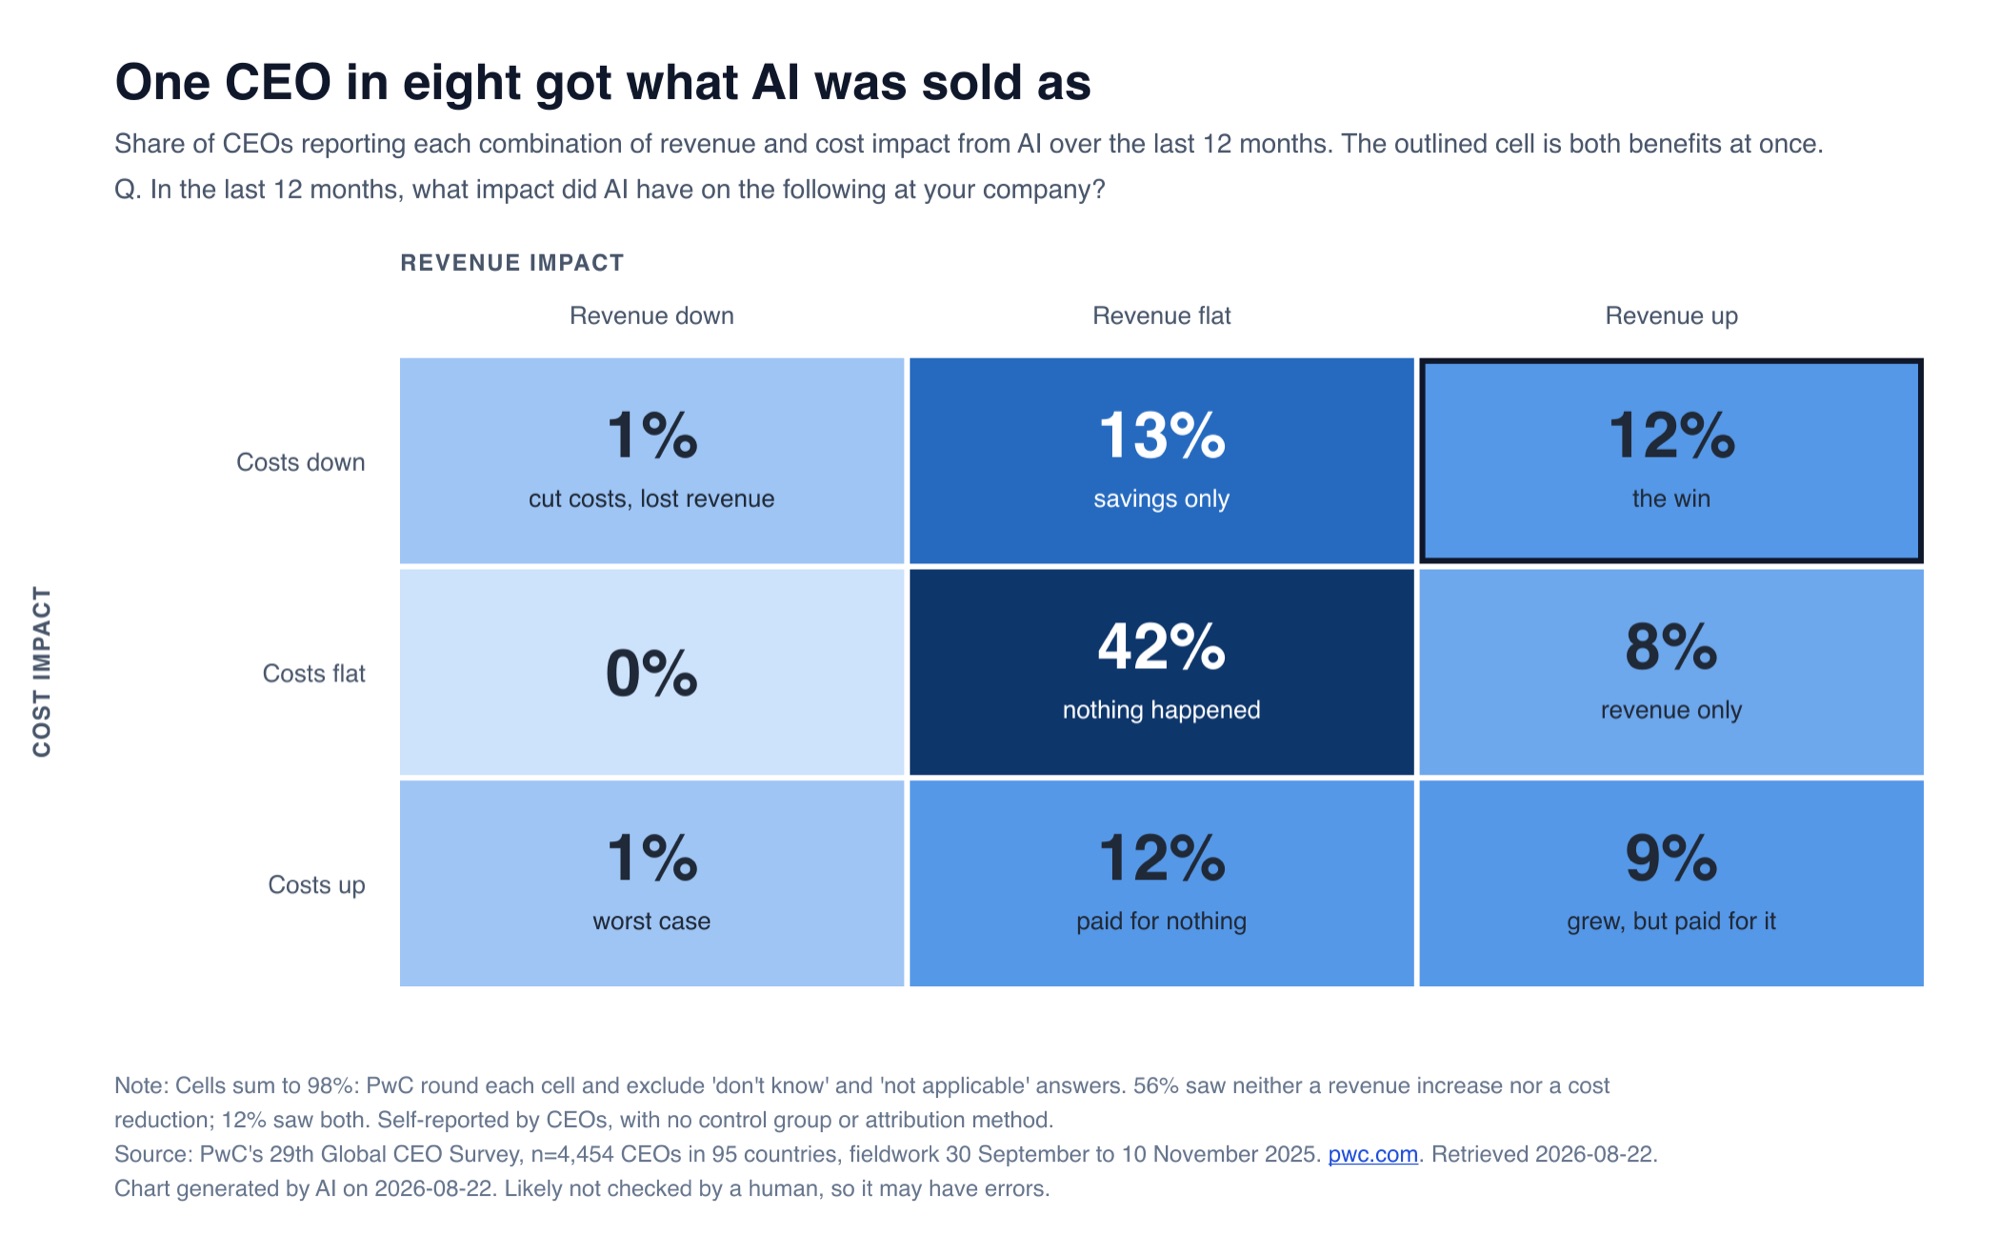
Read the middle box first, because it is the biggest and it is the one the headlines drop: 42% saw neither needle move. The outlined box top right is the 12% who got lower costs and higher revenue together, and the two boxes at the bottom left are the 13% whose costs went up without the revenue following. The margins are where the quotable numbers come from – 30% revenue up, 26% costs down, 22% costs up – but a matrix tells you what two bar charts can’t, which is whether it was the same companies. The cells sum to 98% because PwC round each one and drop “don’t know,” and all of it is self-reported by CEOs with no control group, so what you are looking at is what chief executives believe about their own AI spend.
Source: “PwC’s 29th Global CEO Survey,” PwC, January 2026. n=4,454 CEOs in 95 countries and territories, fieldwork 30 September to 10 November 2025. The matrix is on page 6. Chart rebuilt by the robot.


Leave a Reply