The Cloud Equilibrium
As you know, I enjoy the impossible chase to track down the elusive chart that shows how many workloads are running on private cloud1 versus public cloud. I last rounded up my findings in July, 2024. Of particular interest is the IDC CloudPulse report. I don’t have access to the most recent one, but you can see one of the older charts in an older blog post of mine. When looking at this industry charts, surveys, and other goop, I still think the split is something between 40% to 60% - so, you know, “50/50.” I think of this as the cloud equilibrium. After 18 years of public cloud, we’ve had a long time to sort out which apps go where. Is the equilibrium stable? Using the rule that the future looks pretty much like the recent past, that equilibrium will probably be stable at least three years, maybe five. But who knows what will happen in five years, even four? Who would have predicted all this AI stuff would be such a big deal two years ago? Anyhow.
“Cloud repatriation” has come up here and there recently. It means moving workloads back from public cloud to on-premises. In that way, it’s the wiggle that happens on the edges of the equilibrium.
The stated reasons for cloud repatriation are usually for lowering cost, but I also suspect control (security, compliance, sovereignty, etc.), and functionality fit. Judging the amount of repatriation is difficult, if impossible, based on current industry goop. But, you can tell that it’s a common topic.
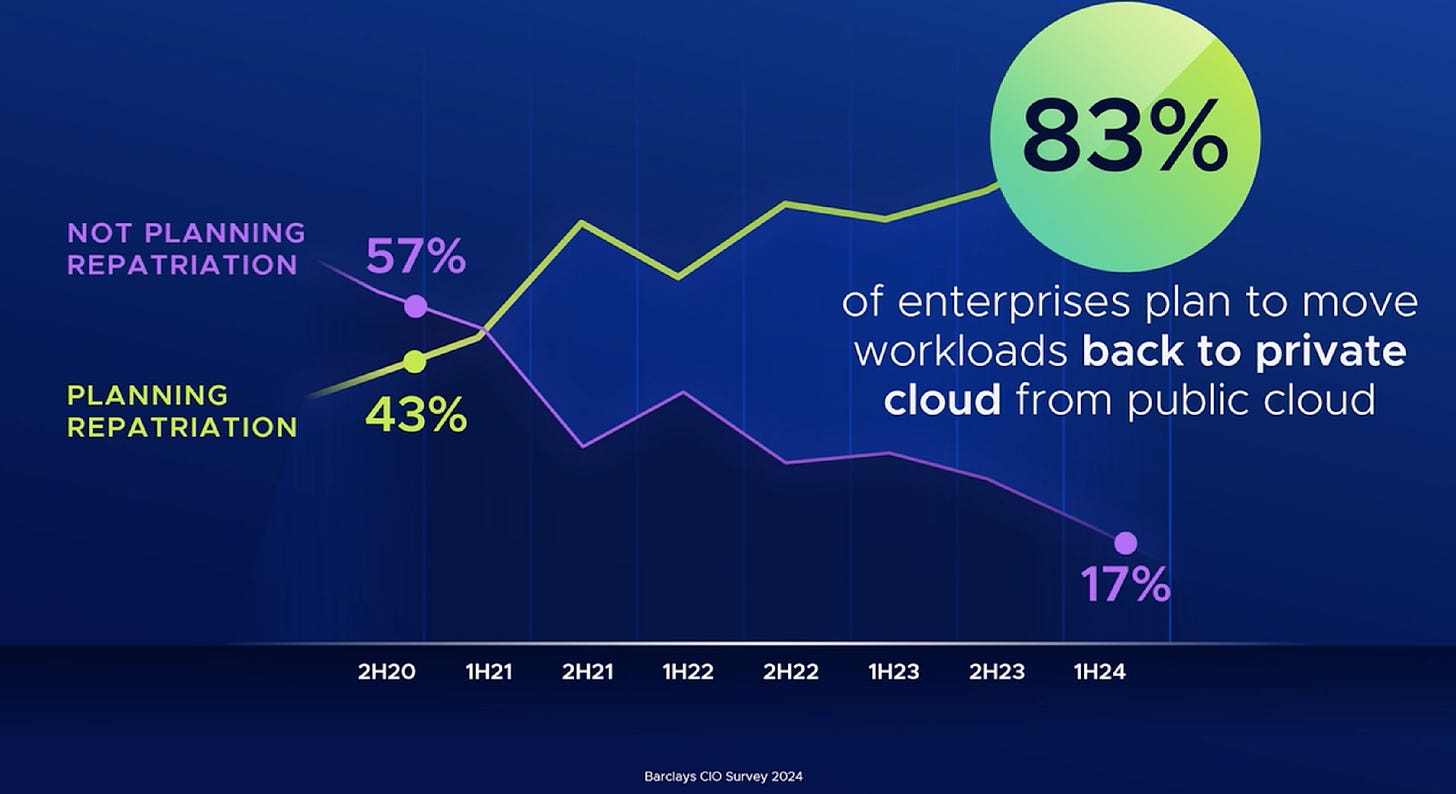
At my work’s conference, Explore, a Barclays CIO survey was referenced and it’s been used a few more times in that discussion.
I finally tracked down the original PDF recently, and here’s the chart the Explore chart is from, also shared by Michael Dell awhile back:
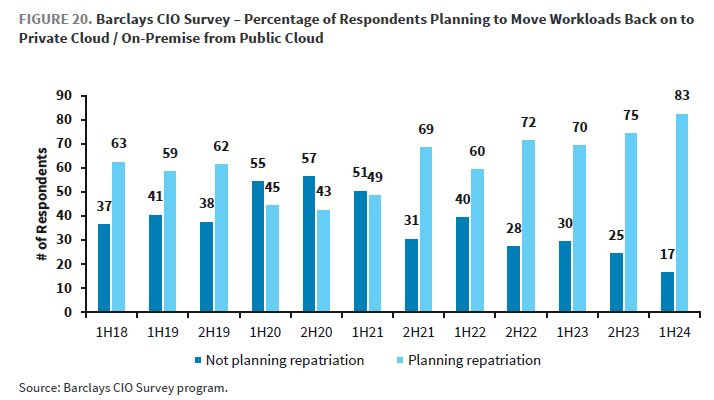
As with the private/public cloud charts I like to use, as worded, the repatriation question above is just about intentions and plans, not what actually happened. That nuance aside, when I combine these plans with the estimates of how many apps are “still” on-premises, there’s another interesting idea: you can't repatriate what never left in the first place. In the cloud equilibrium, there are a lot of apps already on-premises.
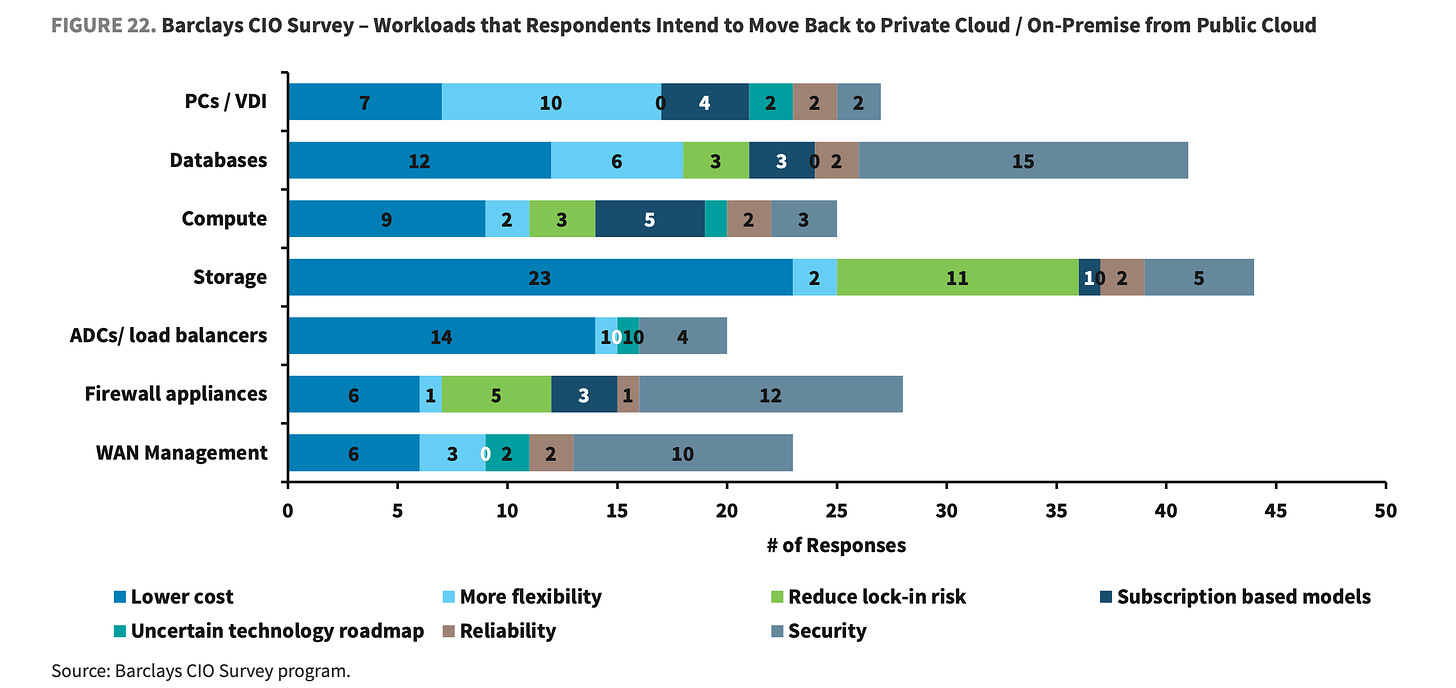
Also, in the Barclays PDF, you can see what types of workloads CIOs are planning on moving back:
It’s a bummer that the apps I care about - custom written applications - aren’t called out there. I don’t know if they’re part of “compute,” but they’d definitely touch “databases.” Maybe custom apps were part of the top seven.
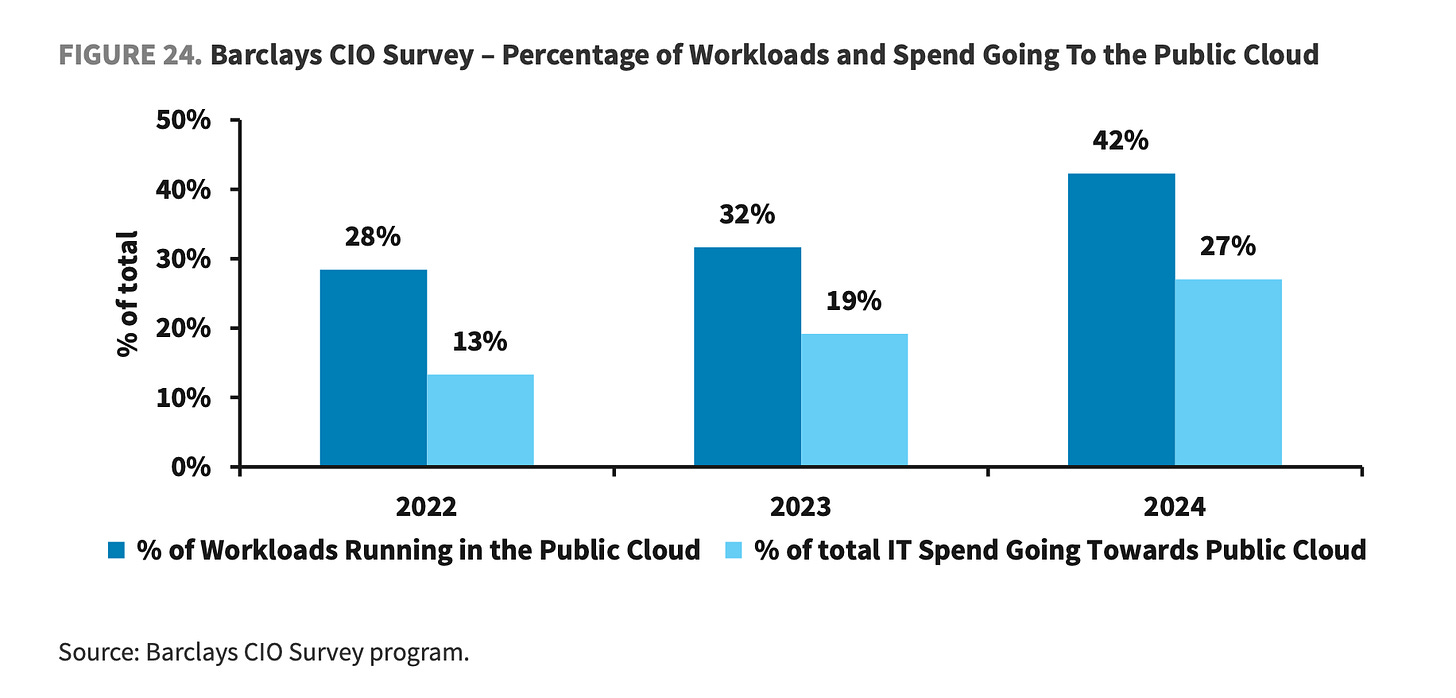
To add more goop to my cloud equilibrium chart pile, in the PDF, you can also see the private/public cloud spread:
Here, you see that CIOs have been moving a lot of workloads to public cloud in recent years, and it’s nearing 50%. That’s a high rate of change year over year, but it’s wild to think that as of 2022, only 30% of workloads were in public cloud.
Also, this new chart for my pile makes the point about how difficult it is to find workload placement estimates. They’re all over the place, mostly different. Compare that Barclays’ chart to the IDC one I linked to above. IDC already had it around 50/50 in 2022 when the Barclays survey has it at 72/28, public/private. Hopefully I can find the 2025 Barclays survey to see what happens next!
What kind of goop do you have on file?
Wastebook
“trad tech companies.” Gregely.
Data is not oil, it’s milk: it goes bad if not used. Here.
Data is power.
A lot of my procrastination is just putting off making a decision that I already know I’ll make. Rather: taking on the debt, actions, and responsibilities of that decision. It can be as simple as having to call customer service, trivial as me wanting to avoid boredom and tedium, and as big as telling someone “no.”
“API surface.”
“EXTRA-ARGS” sounds like the noise you’d make when you need to use EXTRA-ARGS.
Relative to your interests
Docs are the new something - The Google Docs web.
Tanzu Platform for Cloud Foundry’s Hidden Superpowers, Save Money with Java Native - “you can reduce your Java app’s memory usage by 90%. This allows your applications to use fewer resources, which directly contributes to cost savings and more compute capacity”
Google NotebookLM: AI-Powered Document Analysis Tool - Ideas for using NotebookML.
Citi taps Google Cloud for app migration, AI adoption - “As evidence of progress, CFO Mark Mason pointed to 450 apps retired by the bank since the start of the year. Citi has reduced tech sprawl by eliminating 1,250 apps in the last two years, Mason said.” // Thinks of all the zombie apps like that across every organization in the world.
Gartner sounds alarm on AI cost, data challenges - Enterprise AI is like any other enterprise IT project: “CIOs have found generative AI goals harder to attain than first anticipated. Technology leaders are blaming data challenges, technical debt and poor strategy or execution for slowing down progress. Nearly half of CIOs say AI has not yet met ROI expectations, according to Gartner research.” // Data access is the first problem, then your existing systems, then people and process that don’t change how they work to take advantage of the new tech. "AI Transformation?
Enterprise AI moves from ‘experiment’ to ‘essential,’ spending jumps 130% - “Organizations reported a 130% increase in AI spending since 2023.” And: “The research shows a dramatic increase in organizational spending on generative AI, with over 40% of companies now investing more than $10 million in the technology. This represents a significant shift from the previous year when the typical investment range was between $1–5 million.”
How PostgreSQL is Dominating AI and Multicloud - Postgres never goes away.
Platform Engineering: Why You’re Doing It Wrong - Hopefully also how to do to real right.
DORA 2024: AI and Platform Engineering Fall Short - The New Stack - Good summary.
Apple Intelligence
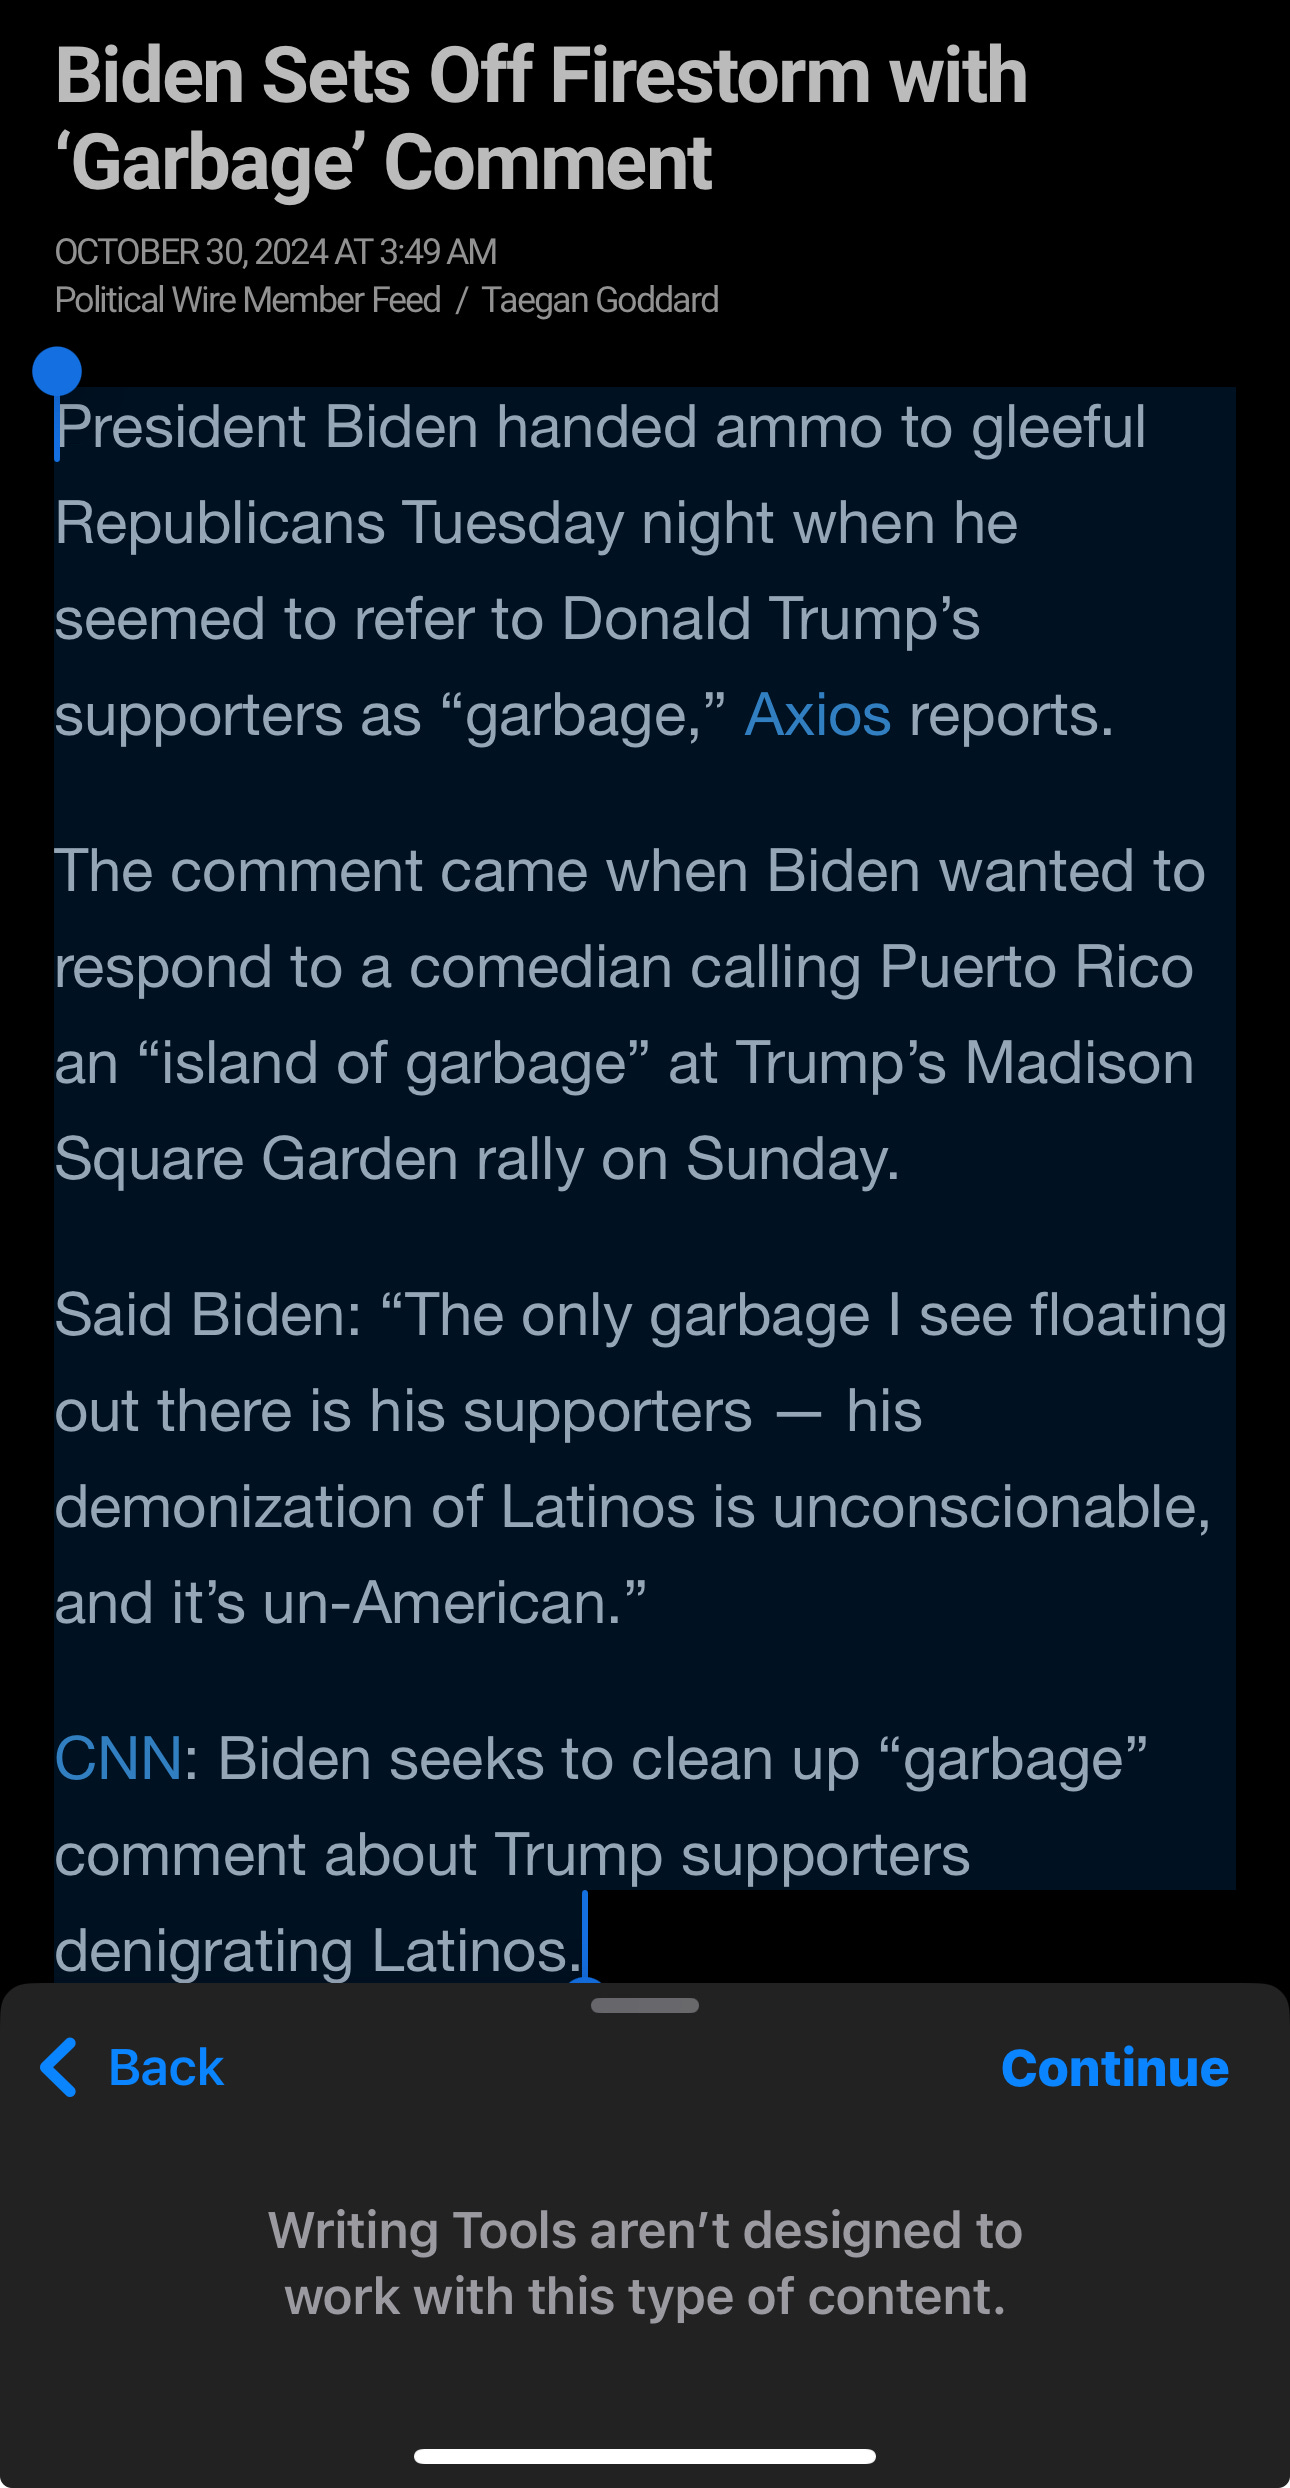
I’ve got the new iOS and Mac updates, so I have Apple Intelligence. So far, it’s alright for simple summaries and rewritings. I’ve used it a few times! However, like Gemini, they’ve fallen prey to AI Cowardice:
I mean, sure, I agree 100% that it’s the right business move. And, it’s probably also the right “how do we sustain this long term enough to achieve escape velocity without The Culture dragging us to the guillotine?” move. But…still: what a disappointment!
I think it’ll be good though, especially when you can actually prompt-coach it more. From what I can tell, with Apple Intelligence features, you can’t put in your own prompt. Boo!
The image editing (removing people) is what you’d expect: not great, a dancing bear. I dub this “weird, but OK.”
Conferences
Danielle has a new pitch for why you should join us at Explore. If you’re going to Explore, be sure to pre-register for my two sessions. It helps! Check out all the poop at cote.pizza.
VMware Explore Barcelona, speaking, Nov 4th to 7th. GoTech World, speaking, Bucharest, Nov 12th and 13th. SREday Amsterdam, speaking, Nov 21st, 2024.
Discounts! SREDay Amsterdam: 20% off with the code SRE20DAY. I won’t be at KubeCon US this year, but my work has a 20% off discount code you can use for registration: KCNA24VMWQR20. Also, it’s “invite only,” but why not try to get an invite to our fancy dinner there?
Logoff
Our big conference, Explore, is next week in Barcelona. It’ll be fun! Here’s details of what I’m doing if you’ve forgotten from the past 52 times I’ve mentioned it here. Rita has a write-up of what feels like everything for you to checkout too.
Tell me if you’ll be there, maybe we can solve the mystery of tapas enjoyment.
Sure, “on-premises” would work - whatever you like. In fact, “on-premises” might be more accurate because then you would be counting workloads that are not running in NIST-canonical “cloud,” I guess. You know, mainframe apps, maybe even LoB apps running in Sharepoint and weird things. Do you count really complex .xls’s? Regardless, you get the more high-level point of this elusive chart, hopefully.
