Creating ROI models for platform engineering is difficult. Here’s three examples of approaches I’ve come across recently.
You’re trying to convince your organization to put an app platform in place (probably either buying one or building one on-top of Kubernetes), to shift your ops team to platform engineering (just after HR finally changed titles from “Systems Analyst II” to “DevOps Engineer”!), or, if you’re like me, sell people a platform.
ROI
“Yeah, but what’s the ROI for it?” the Director of No responds. What they mean by that is “convince me that this change is going to have benefits that we can represent as money, either saved or gained.” A variation is “show me that what you’re proposing is cheaper than the alternatives, including the alternative of doing nothing.” That’s probably more of a “Total Cost of Ownership” (TCO) analysis. Indeed, ROI and TCO models are often used the same way, if not the same spreadsheets. This kind of analysis is also often called a “business case.”1
This is especially true in the post-ZiRP world. When money was “free” and G2000 companies were deathly afraid of Tech Companies, they’d change how they operated based on the capacities they gained, not just on an Excel spreadsheet filled with cash-numbers. Those were good times!
Showing the ROI of a platform is difficult. I haven’t really come across any models that I like, and I’ve seen many of them.
The problem is that platforms don’t generate money directly, so you have to come up with a convincing model that shows how platforms contribute to making money.
Let’s start with the benefits of platforms, and see if we can stick some money to them.
What platforms get you
The benefits of platforms are explained in terms of either:
-
Developer productivity – which leads to improving how an organization can use software to run.
-
Operations productivity – removing the “toil” of day-to-day management and diagnosis of production, but also reducing the amount of time (and, thus, people) needed to manage to platform.
-
“Enterprise grade” capabilities – ensuring security, compliance, scalability – all the other “ilities.”
There’s a fourth category when a platform is a tool in an overall program: usually migrating from on-premises to public cloud or modernization applications. We’ll call this the “enabler.”
These are valuable things, but I’m frustrated with them because they don’t link directly business outcomes, things like: making more money (customer facing), performing a government service in a reasonable way (low cost and good citizen experience), or running a company better (internal operations).
That’s because platforms are just “enablers” of applications. And it’s the applications that directly create those benefits, that “make the money.”
Here’s three approaches I’ve come across recently that are representative of doing ROI, really, for any “enabling” technology.
VCR, IAR, and DTR
In the paper “Measuring the Value Of Your Internal Developer Platform Investments,” Sridhar Kotagiri and Ajay Chankramath (both from ThoughtWorks)2 propose three metrics and an overall way of thinking through platform ROI. This is the most thought-provoking, nuanced/complex/comprehensive, intellectually juicy, and thus all around useful ROI model of the three I’ll go over.
First, they have this excellent chart of linking platform capabilities to business outcomes:
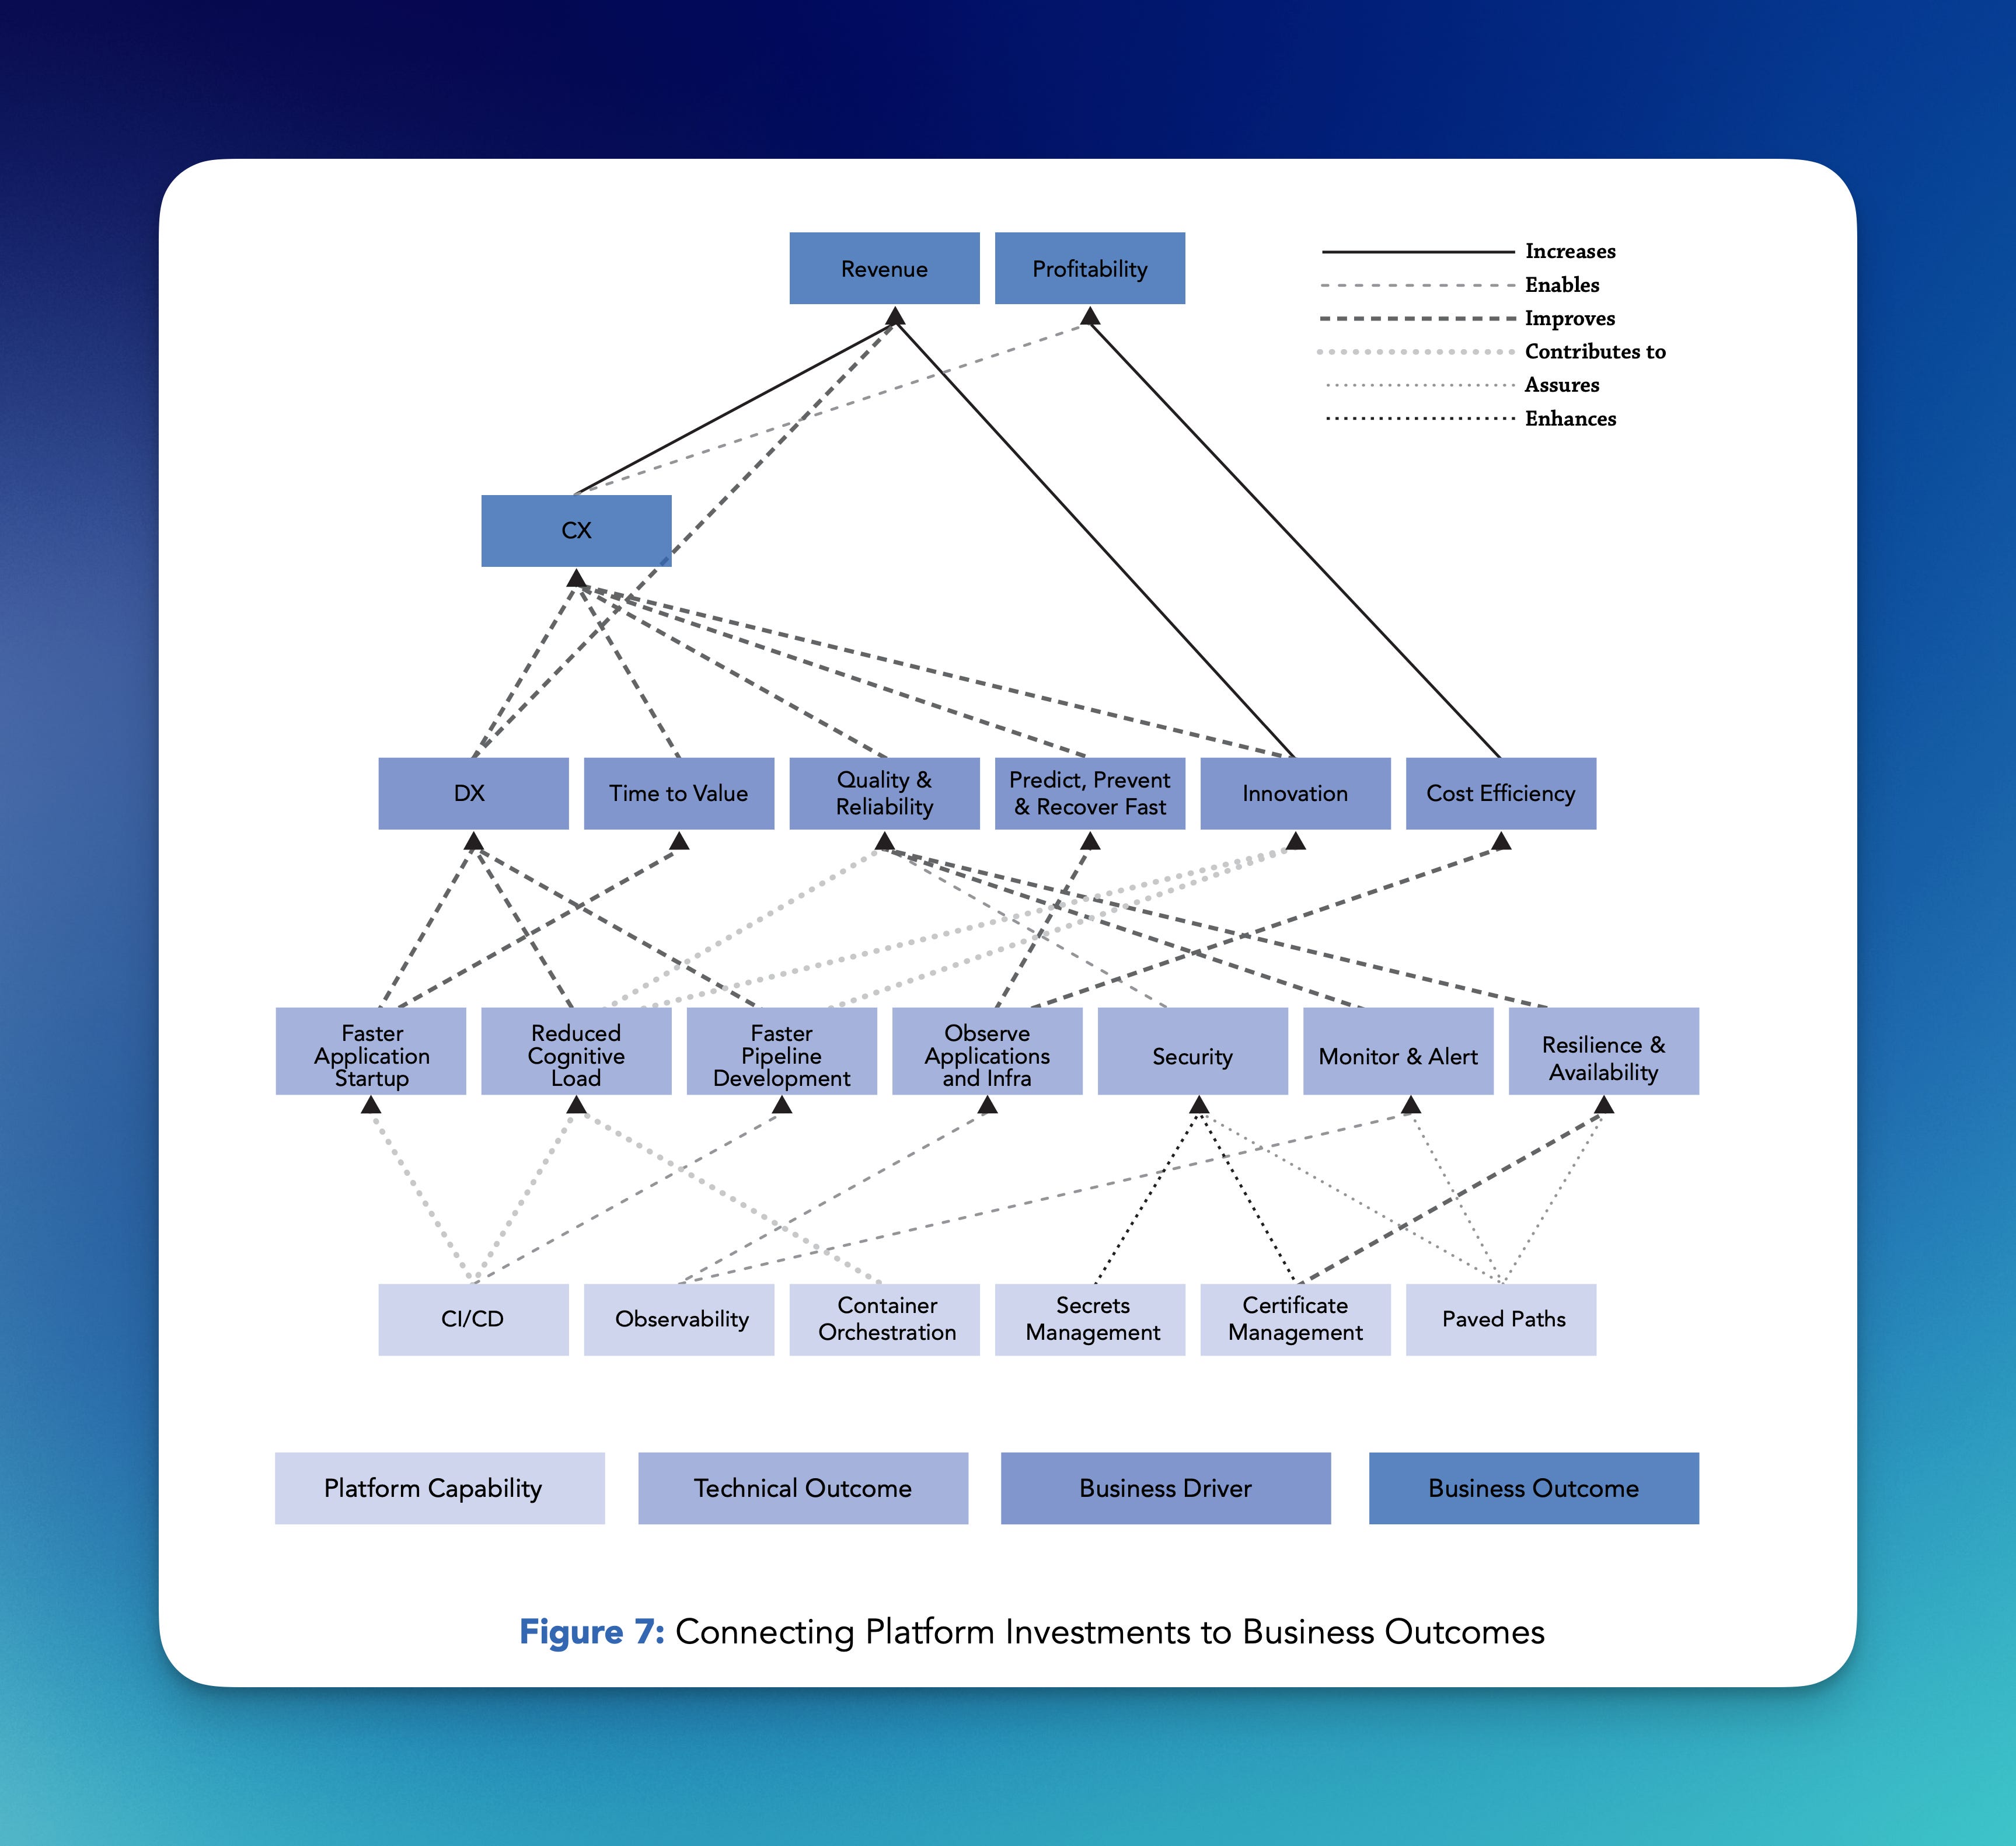
A chart like this is great because it does its primary goal (showing how platform capabilities link up to business benefits) and also defines what a platform does. Here, the three things that directly give you ROI are CX (“customer experience,” I assume, which I’d call “good apps”), innovation (introducing new features, ways of working, ways of solving jobs to be done, and, thus, selling products and services), and cost efficiencies (spending less money).
Cost efficiencies is something you could do directly with a platform. It could cost you less in licensing and cloud fees, it could consume less underlying SaaS, it could require less people. The first two are fine and provable. The third is where ROI models get weird.
ROI by firing people versus doing more with the same
If you’re doing an ROI model based on people working more efficiently (“productivity”) the assumption you’re making is that you’re going to get rid of those people, reducing the amount of money you staff. But are you? Maybe long-term you’ll consolidate apps and platforms and then, a year or so out, layoff a bunch of people, realizing that benefit. If this is your goal, you’ll also need to contend with those future-fired employees reading the writing on the wall and saying “why would I tie my own noose?” and deploying enterprise-asymmetric psyops counter-measures.
Historically, the idea that automation is going to reduce staff costs has been dicey. You encounter Jevon’s Paradox: the cheaper it is to do something, the more of it people will do, often in excess.3
Thus, the more clever thing to do with productivity is to talk about how you can now do “more with the same.” You can give developers more time to work on more features, driving “innovation” and “CX.” Your operations people can now support more apps. Your cost of adding new stuff is cheaper. When you add ten more apps, you don’t need to add another operator or more developers because your existing staff now have more time available.
But, then you’re back to the problem of platform ROI: you’re talking about capabilities you get. And, until those capabilities are “realized,” you won’t know if your platform was useful. Also, there are so many things that could go wrong – or right! – that might be the more direct cause of success.
Nonetheless, I think the framing of “we never have enough time to do everything the business wants, right? If we had a platform, we would!” is pretty good. Instead of ROI, you’re directly addressing a problem, and a problem that’s stressful and probably keeps people up at night.
Three formulas for predicting and tracking ROI
The paper encourages the use of three formulas to track your platform’s value. You could use them to predict the platform’s ROI, but that would rely on you believing the input numbers you, uh, made up ahead of time.
-
Value to Cost Ratio (VCR): VCR = (Projected Value / Projected Costs) * 100.
-
Innovation Adoption Rate (IAR): IAR = ((Adoption in the current year – Adoption last year) / Adoption last year) * 100.
-
Developer Toil Ratio (DTR): (Total Time on Toil / Total Time on Feature Development) * 100.
Here, you encounter one of the basic problems with any platform metrics: how do you collect those numbers?4
-
VCR – this is what most people are after with “ROI.” However, how do you figure out those numbers? Proving the “Projected Value” of a platform is the whole problem!
-
IAR – counting the apps on your platform versus all of the apps in your organization is achievable, more or less. People struggle with accurately tracking IT assets counting: most people don’t trust what’s in their CMDB, let alone have one, or, worse, even know what a CMDB is. But, I think most people can do some helpful app counting. This metric is tracking how much your platform is used. It assumes that usage is beneficial, though, which, for me, de-links it from ROI.
-
DTR – this is the productivity metric and a good one. Collecting those two numbers, though, is tough. It’s probably best to stick with the “just ask the developers” method that DX encourages. That is, don’t waste your time trying to automate the collection of quantitive metrics, and instead survey developers to get their sentiment of “toil versus coding.” What I’d to this is that you should also consider the OTR: Operator Toil Ratio. How much time are you operations people spending on toil versus more valuable things. In the context of platform engineering, this would be product managing the platform: talking with developers and adding in new features and services that help them and other stakeholders.
I like this paper, and I think it creates a good model for even thinking about making the case for a platform and doing some portfolio management of platform engineering. Linking up platform functions all the way up to business outcomes (the big chart above) is great, and in many cases just using that big chart to explain the role platforms play in the business is probably very helpful when you’re talking with the Director of No. If that chart grabs their attention, the next conversation is talking about each of the boxes, what they do, and why doing it in a platform engineering way is better, more reliable, and “cheaper” in the “do more with the same” sense.
The Big Spreadsheet
The second model uses a large spreadsheet to track common developer activities, the cost of operations problems, and staff costs to show platform ROI. If you’re lucky, these are usually large spreadsheets with upwards of 50 numbers you need to input from salary, cost of hourly downtime, number of applications running on the platform, and the benefits of improving apps.
Once you “plug in” all these numbers, a chart with two lines intersecting usually shows up: one line is cost, and the other is benefit. At first, you’re operating in the red with the cost line way up there. Within a year or two, the lines streams cross, and you’re profitable.
Gartner has a pretty good one for platforms which, of course, I can’t share. Here’s another example from Bartek Antoniak:

One line I don’t see often are one-time-ish costs like the cost of migrating apps to the new platform and training people. Even cooler – but hard to quantify – would be the future cost of tech debt in the existing platform and app model.
Getting all of the input numbers is the problem, once again. How do you measure “increased speed of software delivery” and “mitigate security and compliance risk,” or something like “optimize the use of infrastructure due to the self-service and developer portals”? How do trust those measurements and even the more straight forward ones like
There’s a good trick here though: if it’s difficult to gather those numbers, chances are you have no idea what the ROI of your current platform is (the “do nothing” option when it comes to introducing platform engineering). I suspect this is how most organizations are. The Director of No is saying platform engineering is a bad idea…but has no idea how to quantify how well, or poorly, the current “platform” is doing.5
Filling out the giant ROI spreadsheet will probably drive how you think of and decide on platform ROI.6 Tactically, this means that you want to be the first one to introduce a complex model like this if you’re in a competition to get a platform in place. This could be if you’re battling internal competition (some other group has an opposing platform and/or the option is to do nothing), or you’re a vendor selling a platform.
Whoever introduces the ROI model first gets the define the ROI model.
Like canonical ROI calculations, these models are also showing you return over time, usually in three to five years terms. This can introduces an executive ownership problem. While the average tenure of CIOs is actually longer than most people joke about – four or five years, depending on the industry and geography – people move around on projects and within groups in IT.
A positive ROI model assumes you’ll see it through to the end without changing it. So, if the “owner” of the model has shifted and given ownership to someone else, you may not stick to the original plan. There’s also the chance that people will just forget what the point of the ROI model is and, more importantly, the plans that go with it. Pretty soon, you’re making new ROI models. A good test here is to see how quickly you can find the current ROI model (or “business case”) that you’re operating with.
Aggregate ROI
Instead of making a template for your ROI spreadsheet, you can aggregate the outcomes from several organizations. You still have The Big Spreadsheet in the previous example, but the point of the aggregate ROI is to show that the platform has worked in other organizations. The aggregate ROI is trying to convince you that the platform benefits are real and achievable.
Vendors like using these, of course, aggregating their customers. We put one of these out recently, done by ESG.

As ever, the problem with using this type of ROI is getting your input numbers. However, I think aggregate ROIs are good for both figuring out a model and figuring out a baseline for what to expect. Because it’s based on what other organizations have done, you have some “real world” numbers to start with. When vendors do it, these types of studies often contain quotes and testimonials from those customers as well.
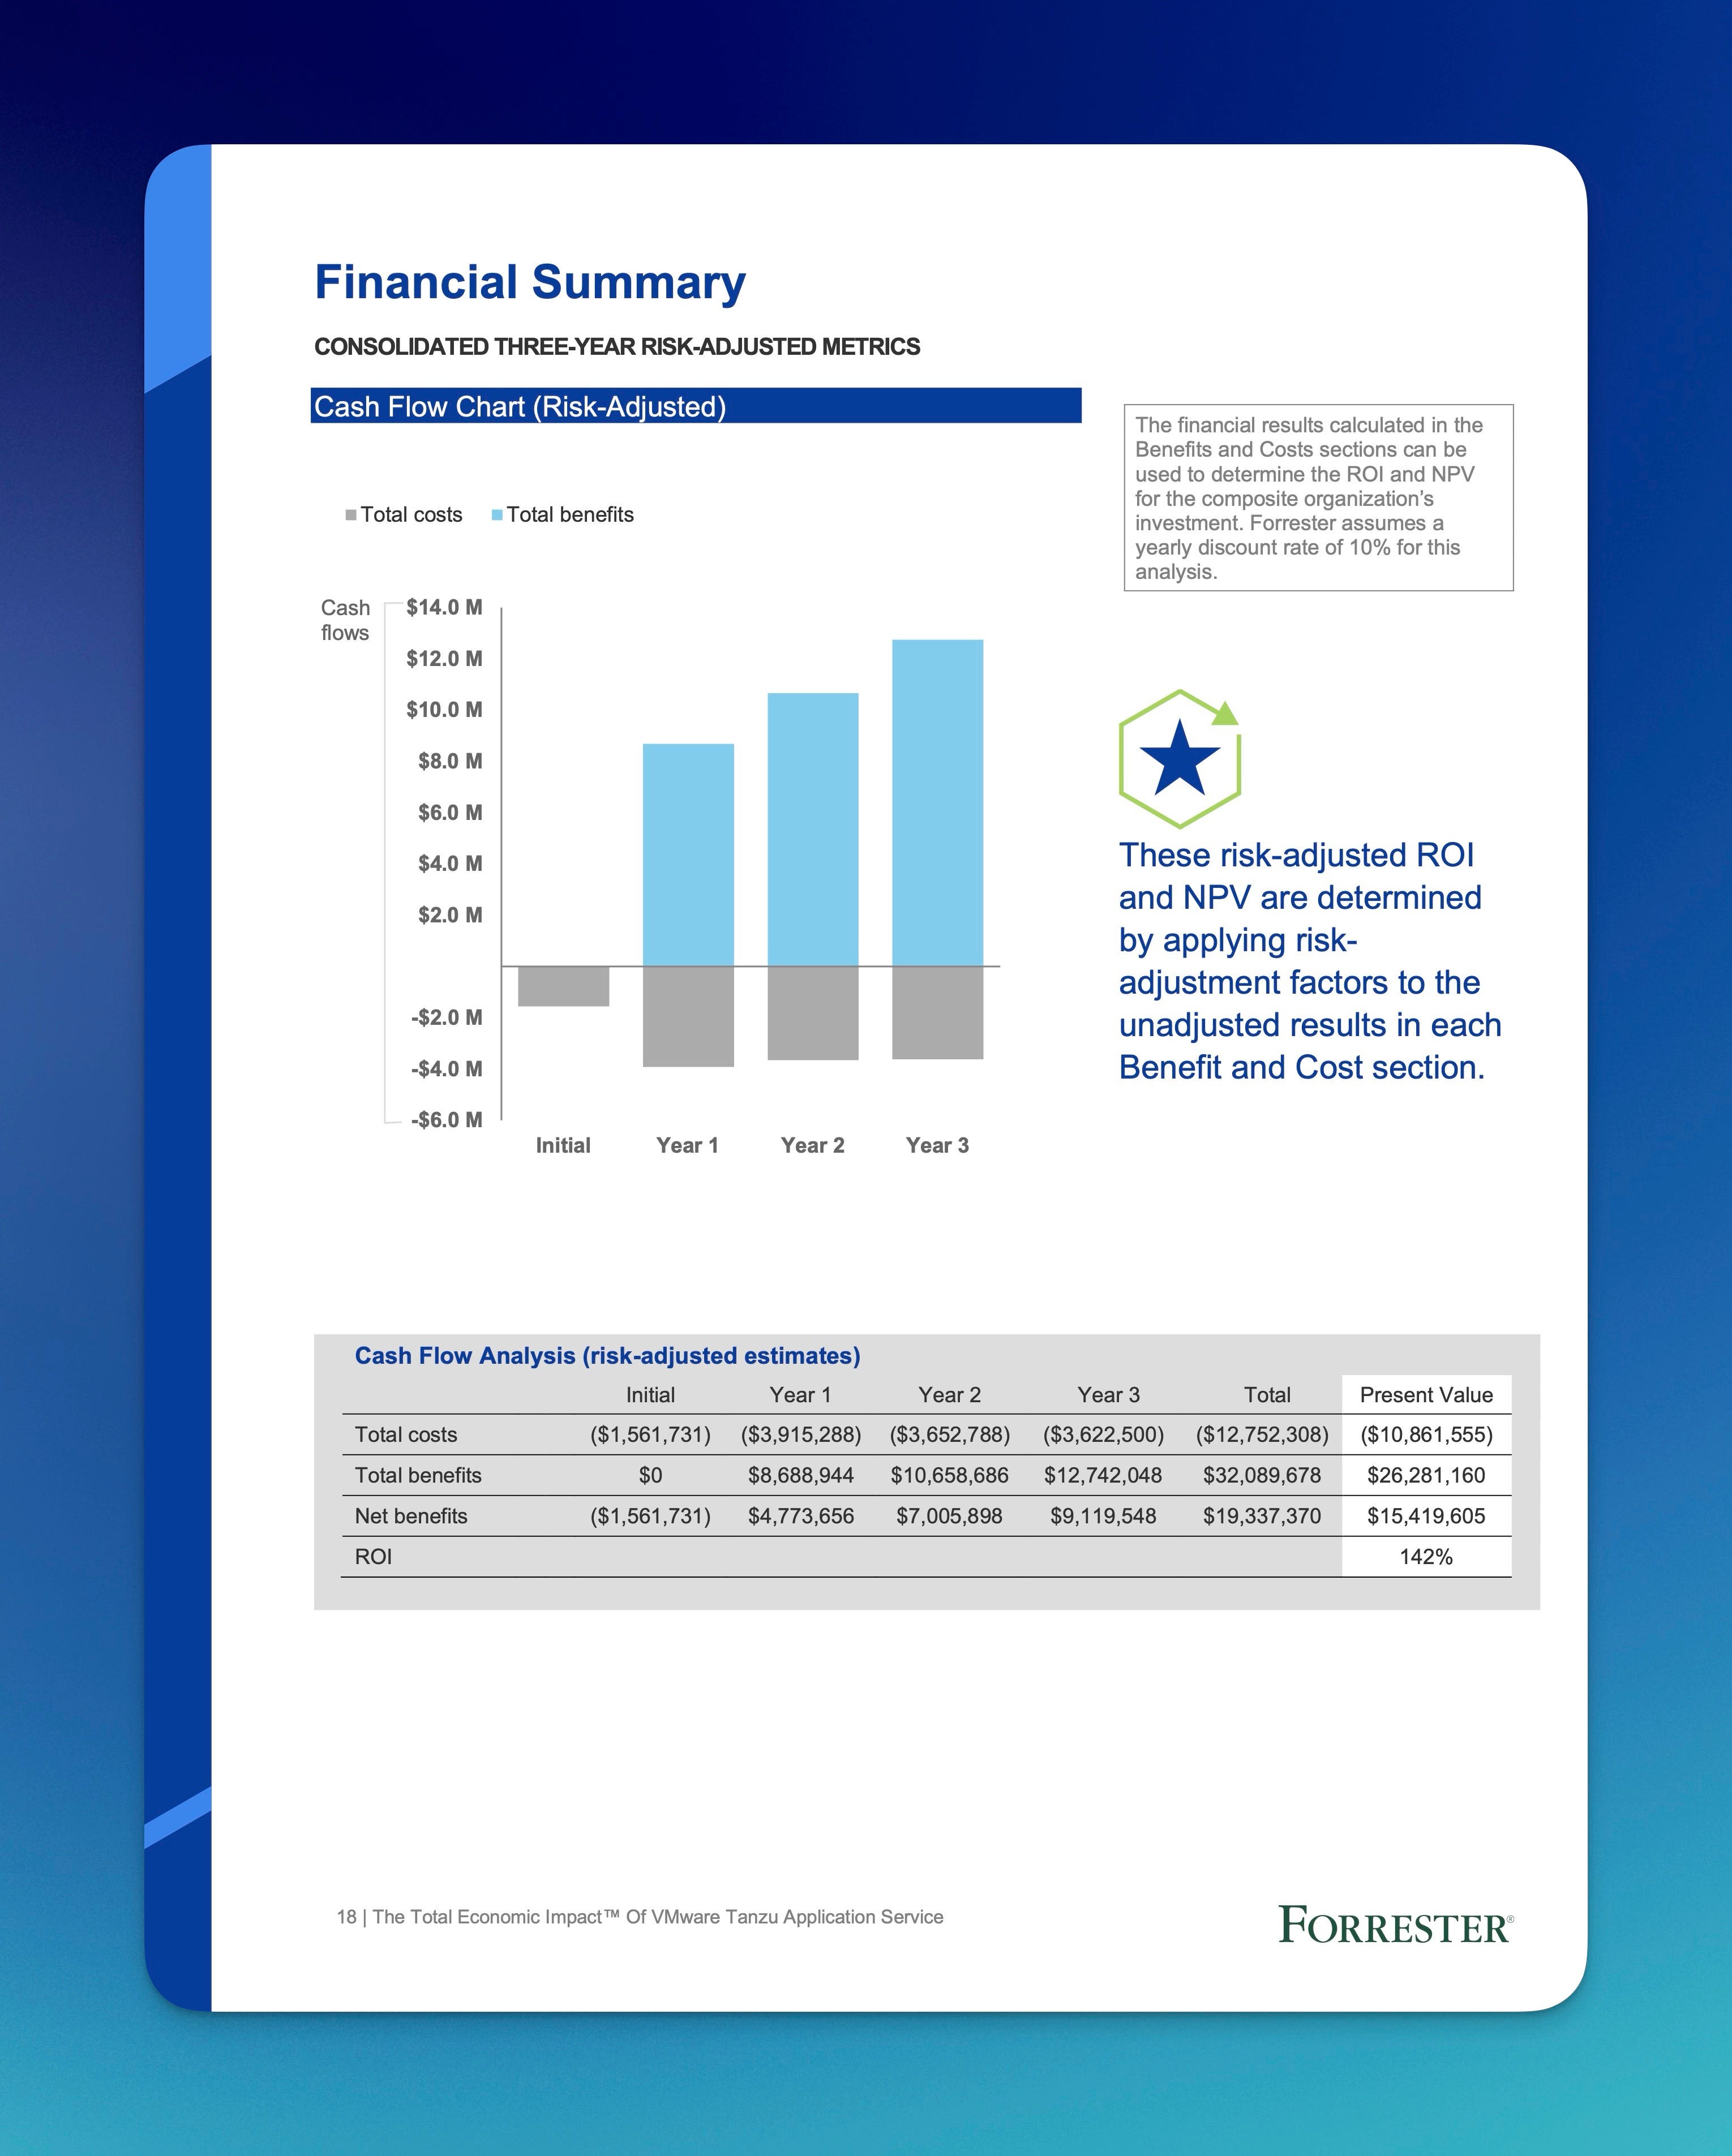
You can hire Forrester Consulting to do their “Total Economic Impact” studies. Here’s a very detailed one from 2019 on Pivotal Cloud Foundry (now called Tanzu Platform for Cloud Foundry, or tPCF for short). Because they do these for multiple vendors, it’d be cool if they somehow aggregated all the aggregates. And I wonder if they use the same models for the same technologies?
You notice how I typed Forrester Consulting? That’s because it’s not “Forrester the industry analysts you’re thinking of.” Because you’re commissioning people to work on these TEIs (and other aggregate ROIs), it’s easy to carelessly dismiss them as paid for.
Sure, there’s certainly selection bias in these studies – you don’t hire them to analyze an aggregate of failures. But, these aggregate ROIs are still useful for proving that the platform works. That old TEI report interviewed four companies and based their model and report on them, same for the newer one. As with all the ROI examples, here, the aggregate ROI is also showing you an ROI model for platforms.
Us vendors have an obvious use for these PDFs: to show that our stuff is great! If you’re not one of us vendors, and you’re using these kinds of ROIs to get past the Director of No, I’d suggest looking at PDFs from rival companies and doing a sort of “aggregate of aggregates.” You’re looking to:
-
Prove the concept of platform engineering and the worth of platforms.
-
Show that it’s achievable at similar organizations – it’s not just something that Google or Spotify can do instead of “normals.”
-
Establish a baseline for results – we need to achieve results like these four other companies for it to make sense.
-
Create/steal a model – as with the last two ROI models, just having a model to start with is useful.
Beyond ROI
All of this started because someone asked me to help them put together a developer survey to show the value of platforms. A couple years ago I helped get the developer toil survey out. That survey doesn’t really address the value of platforms. You could use it to track ongoing improvement in your development organization, but attributing that to platforms, AI, or just better snacks in the corporate kitchen isn’t possible. I’d still like to know good survey questions that platform engineers would send out to application developers to gauge ongoing value.
Logoff
That’s enough for today! I’m already late for a call (tangentially on this topic!) so I didn’t even proof read the above. NEWSLYLETTERSSSSS!
In my experience, “ROI” in these conversations is not as simple as strict definition of Return on Investment. It’s not like ROI of an investment, or even ROI on, say, moving physical infrastructure to virtual infrastructure, or moving on-premises apps to SaaS. Instead, as in this scenario, it’s something more like “convince me that we should change based using the language of money in an enterprise.” That’s why terms like “outcomes” and “value” are thrown around in ROI conversations. They add to the business bullshit poetry.
Before reading it, I had no idea this paper was sponsored by my work, VMware Tanzu. Fun!
There’s an interesting take on “efficiency” in this long pondering on why there’s now less ornamentation in architecture than the past. In theory, since it’s cheaper to produce building ornamentation due to, you know, factories and robots, it should be cheaper to put them on buildings. And yet, we don’t! The author more or less says it’s due to fashion and fancy, driven by “a young Swiss trained as a clockmaker and a small group of radical German artists.” This is pretty amazing when used as an analogy to tech trends. Major shifts in tech usage can often seem irrational and poorly proved – you’re usually going from more functionality and reliability, to less functionality and reliability…because the developers think it’s cool, or just doing “resume driven development.”
DORA metrics also have this problem, especially when you scale up to hundreds, worse, thousands of applications. You’d think you could automate a lot of the basic collection, but there’s a certain – I don’t know – do metrics tell you what’s happening, or does measuring the metric make what’s happening happen? I’m not a quantum physicists or 20th century management guru, so I don’t know what I’m talking about, I guess.
There’s a related thing you can do when the Director of No doesn’t know the ROI for doing nothing. You can do an end-to-end mapping of how software goes from idea to production, mapping out a pipeline, value stream, flow: whatever. Often, very few people know every step that happens, let alone how long each step takes or the wait-time between each step. Coupled with a general feel that their app and ops team are not doing enough or “working smart” enough, this analysis often motivates them to do something different.
There’s that observer effect problem again!
Leave a Reply