Has DevOps reached its goals from way back in the late 2000’s: deploying multiple times a day and having developers work closely with operations people? Adam Jacob brought up this question in two interviews recently, on my podcast, interviewed on my podcast by Matt Ray this week (which I [cough] haven’t, well actually listened to yet - maybe on the dog walk after I finish up here], and the Cloudcast, interviewed by Brian Gracely (I listened to that one real-good-like!).
Conclusions
After looking at it, my answer and analysis is:
Deployment frequencies (if I remember how they were in the 2000s) got much better, but have long stalled out at, I’d estimate, 50% deploying monthly or less. Not much progress has been made there for several years. But, if we readjust the goal from “multiple” times a day to “a month or less,” things have gone pretty good.
Application developers working closely with operations is not clear. Perhaps it wasn’t exactly the idea in the first place, and has been replaced by having a good platform in place for application developers. (We just need to finally focus on building that platform instead of re-starting it every five or so years.)
Without finding a bunch of charts to back this up, the job and culture of operations seems to be a lot better.
Now, let’s take a look at some charts to see how I got there!
(Oh, but first…)
OO Config & Release Management
First, how about the new idea Adam is showing up for?
I saw Adam reveal his new company back at cfgmgmtcamp. Their approach to configuration management looks nice: it’s like going whole-hog on object oriented programming for configuration and release management.
I mean, any configuration and release management ultimately rests on the actual code that updates the configuration: from fancy Kubernetes reconciliation, calling APIs on infrastructure, down to brute forcing it with automating SSH calls to modify weird Linux files. It is very gritty, tedious, and grueling that’s hidden behind clean abstraction layers (blah, blah) at the top. We’ll see how that work goes!
This new approach looks like fun, so hopefully we’ll see more of it.
Back to the idea that DevOps hasn’t met it’s goals.
Spock and Scotty Working Together
How would you rate the spread of DevOps? There’s a few metric-able things: Adam talks about developers and operations people working closely together on a release. I’m not even going to pour through my decade plus of saved PDFs to find a year/year survey question about that. It’s have to be something like “are operations people embedded on application development teams?” I’ll just add my anecdotes from talking with regular enterprises (read: not tech companies, large 5,000 to 10,000+ employee organizations) over the past ten years: no. (There’s a bonus chart below that sort of backs this up.)
Further, when you look at the talk around “platforms” for the past seven or so years (currently going under the phrase “platform engineering”), the whole space is pretty clear about keeping operations people separate from developers. The point of a platform, after all, is to automate as much of operations (esp. configuration and release management, but also just figuring out how to integrate everything together) as possible so that developers can focus on their applications - “moving pixels on the screen” as I like to say. I mean: this is great! YES, more of that.
Over the years, and once again, Andrew Shafer and friends have been reminding us that Warner Vogels mid 2000s decree that “you [application developers] build it, you run it” does not mean application developers run all of it down to the metal. It means that there’s a platform in place doing all of the hard work.
Deployment frequency, CI/CD

Deployment frequency is one of the major focuses of DevOps: how often can you deploy new code to production? Before culture emerged as - I don’t know, I’d say - the primary focus of DevOps, deployment frequency was a primary metric. This is the metric I’ve tracked over the years.
Deployment frequency the one I use to rate how well things are going when it comes to doing better at software. The more frequently you can deploy your applications, the more frequently you can learn what your users are doing, experiment with ways to do them better (by introducing new features in the apps and modifying existing ones), and get feedback about improvements. This is known.
The goal of DevOps early on was getting to daily deployments. Hmmm…“goal”: I don’t know, at the very least the aspiration and what seemed cool. However, over the years, and knowing the rates that large, not tech companies deploy, I think weekly to monthly is a fantastic goal.
I like to focus on “large, not tech companies” because tech companies are outliers to me. I care about what governments, banks, not-Amazon retailers, logistics companies, pharma…you know, the companies that fill our everyday lives when we’re not doom scrolling.
DORA - 81% deploy monthly or less, but the charts are weird & tech companies are over-represented
First, let’s look at the holy PDF, the DORA report. (Side-note: did we ever get the story of why the DORA reports forked from Puppet? It’s been long enough now that surely the tale can be revealed!)
There isn’t a chart that explicitly shows the percentage breakout of deploy frequencies, but you can make one if use the four clusters they have, which are created by various levels of the DORA metrics, including deployment frequency.
Here’s the chart of the percent of respondents in the four categories over the past four years:
I rebuilt the chart to a 100% stacked bar chart focused on deployment frequency (yes, one of them adds up to 107%: ¯\_(ツ)_/¯):
First, the span of “weekly to month” is kind of annoying. I’d want to see multiple times a day, daily, weekly, monthly, six months, an annually.
Second, things are weird in 2022 because they threw out the elite category (green above) because:
we don’t consider any cluster to be elite this year. This year’s high cluster is a blend of last year’s high and elite clusters. We decided to omit an elite cluster because the highest performing cluster simply isn’t indicating enough of the characteristics of last year’s elite cluster.
These numbers go back and forth so much over these four years that I’m not sure what to make of them.
The 2022 results are pretty bonkers: the report authors say the pandemic might have caused the huge shift to weekly to monthly Going from 28% to 69% is super-bonkers. You could look at just 2018 to 2021, but then 2019 is the whacky year too. Or you could look at changes in “elite” (deploying multiple times a day), but then since there weren’t enough elite performers in 2022, that 26% of respondents who deployed multiple times a day evaporated…?
I could look at shifts in demographics each year: were there big shifts each year? Like, were there more people reporting from large, not tech companies? From lagging geographies? From more conservative roles in the organization that might not have visibility into deployment frequencies (or the opposite)? But, I didn't!
So, let’s say that in 2022 11% of respondents can deploy daily or multiple times a day. By the goal of deploying multiple times a day, then, DevOps hasn’t had much success. However, again, getting large, not tech companies to deploy “weekly to monthly” things have been pretty fantastic.
But! By the goal of monthly or less, you’ve got 81%, which is clearly great.
However, since over 50% of DORA respondents are consistently from the tech world, I’m not sure. I’d want to throw out tech companies and just look at what’s left before concluding much.
(I looked at the 2017 to 2015 reports for these breakouts but couldn’t find them.)
State of Agile Reports - ~50% lack CI/CD capabilities
I’ve used the State of Agile reports over the years to track even the possibility of deploying frequently. These reports asked survey respondents if they used CI and CD tools. My theory is that if you don’t have CI and CD, you’re going to have a tough time deploying frequently. It’s certainly possible! …but not likely. We’ve all heard tales of people sftp’ing code changes to production, after all.
They stopped reporting on these metric in 2022. What I see in this chart is a steady growth in continuous delivery (the empty bars), but stalling out for continuous integration (the filled in bars).
Another way of reading this is that over the years, about 50% of people do not automate their builds (or maybe “pipelines”) because they don’t even have continuous integration.
I didn’t lookup the company demographics since I’d already made this chart sometime ago, and I’ve already spent a lot of time typing all this up. I’ve got webinars I’m supposed to be making slides for, friends.
By this metric, DevOps doesn’t seem to have done well at deployment frequency. At the very least, you’d want to automate the pipelines. I think?
CD Foundation - ~65% deploy monthly or less
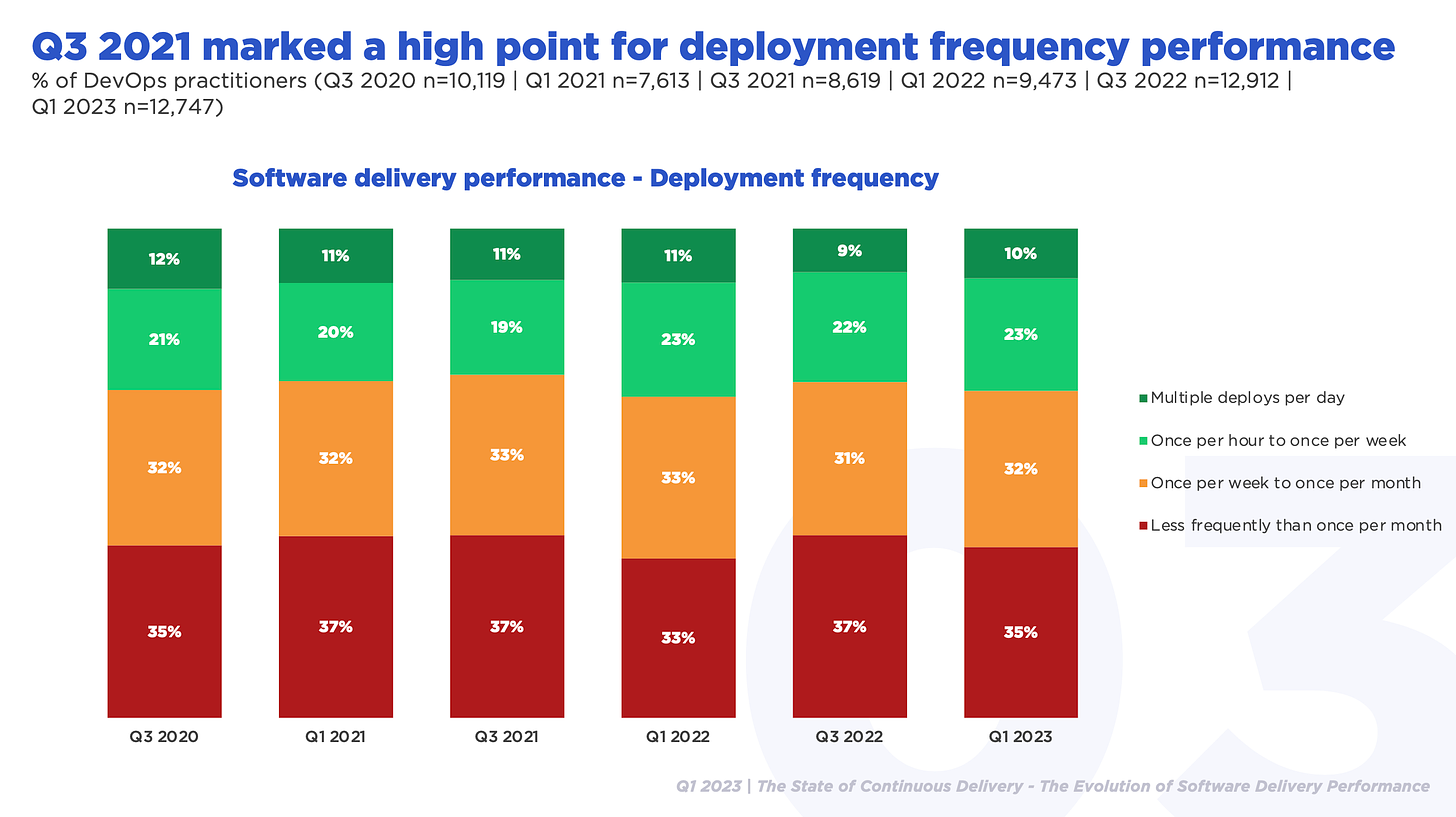
Thankfully, the CD Foundation surveys have an easy to find, multi-year charts of deployment frequency:
So, here, we’re at about 30% for daily or multiple times a day. 35% for monthly or more, an equal amount for between a week and a month. So, let’s say, 65% can deploy monthly or less. That’s good.
What’s striking here is that it’s stabilized since late 2020, for the past 2 and half years (or whatever that calendar math is).
Without seeing the company size and industry break out, I can’t comment on large, not tech organizations. But, they throw in some commentary on large organization’s lead time (time from committing code to deploying, so a little different that deployment frequency [rolls eyes]):
Among developers at large enterprises (more than 1,000 employees [I’d call these medium-sized companies, but whatever -Coté]) we began to see an increase in top performers for lead time for code changes to 21% in Q1 2022, which has since decreased to 16%. However, despite the percentage of top performers decreasing, we still see that 40% of developers have lead time changes of less than one week, the second highest since we began asking developers.
So, 60% of developers at large enterprises have a lead time of a week or more. If we assume the week to month is similar to deployment frequency (like, 30%), then we have 30% doing a month or more. I don’t know, I just made that up!
Here, DevOps things are pretty great, but not getting greater.
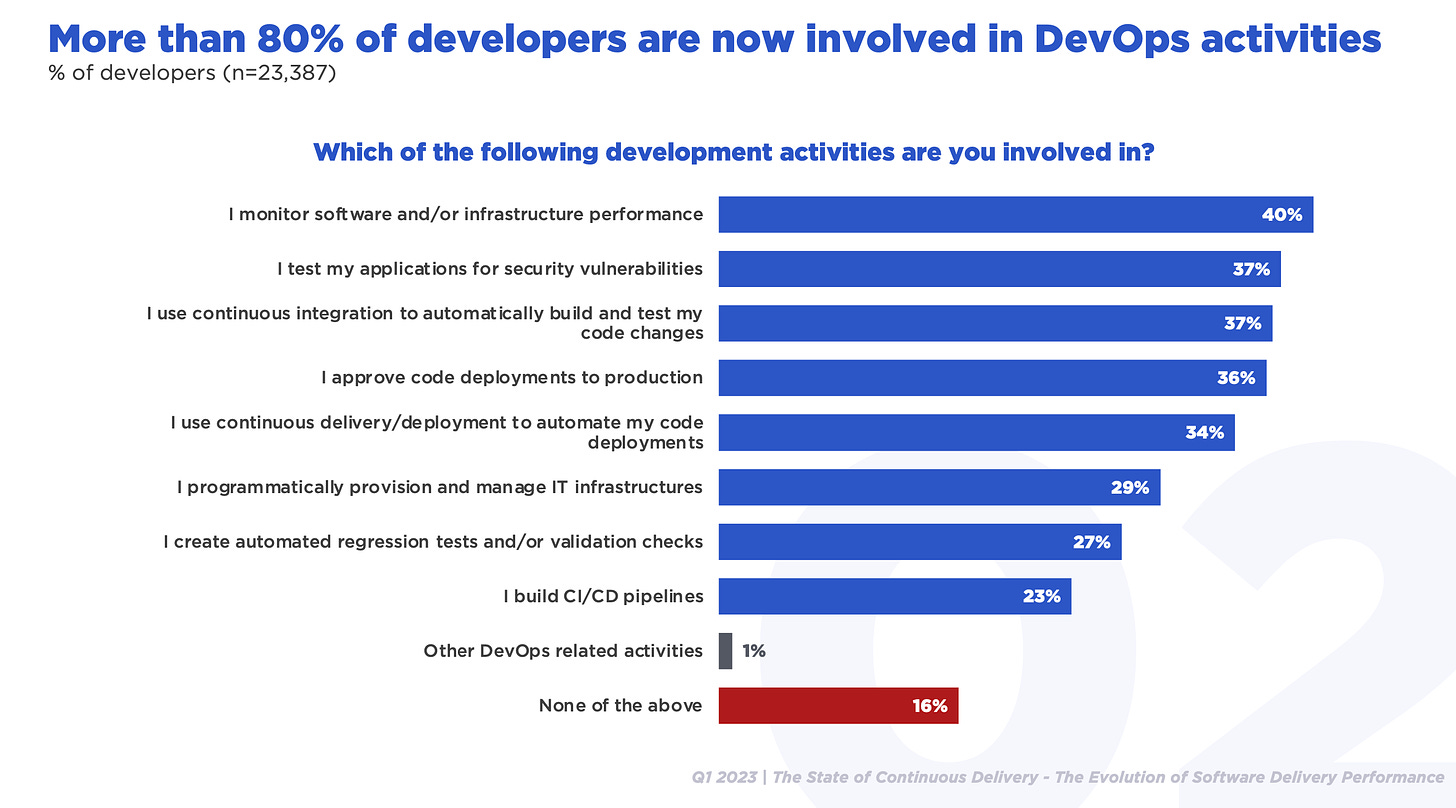
As a bonus, here’s a chart showing the types of activities developers say they’re involved in
This is interesting when thinking of the “are the Devs working with the Ops…or at least, doing the whole ‘you build it, you run it’ thing?” Some are, but, sort of, less than 50% are doing many of the activities I’d call “DevOps.”
Forrester - 27% to 42% deploy monthly or less
Here’s two charts from Forrester:
First, it’s a little jarring when the legend and the chart are in opposite order, but, hey, maybe The Book was out of print at the time.
In this chart, 25% of people release monthly, while 50% are between a month and a quarter. 12% release weekly, and 6% release 1 to n times a day. Here, we have 42% (in 2021) of people releasing monthly or less.
In 2022 they changed the way they ask the question to: “How often does your team release through automation large or entirely new applications?” resulting in this:

So…let’s say 86% release their software a month or more: 15% average monthly, 31% average it every quarter, 26% twice a year, and 13% a year or more. And: 27% a month or less.
Forrester also asked for average/common release frequencies:

In the above chart, you get 26% of respondents saying they average a month or less to deploy.
So…27% to 42% of respondents deploy a month or less. Not too hot for DevOps.
Things are OK, but not super-fantastic
I don’t know, let’s say: “this Liberal Arts major concludes that something like 50% of organizations deploy monthly or less. [throws smoke bomb, and disappears!]”
13 years after the Spock and Scotty talk, things are probably better than they were back then. The only chart I have that goes back that far is the State of Agile one, which has shown tiny improvement since then.
I think the focus of DevOps has changed over the years and is less about deployment frequency and more about, I don’t know, making sure your software actually works in production - resilience? Also, as Adam comments on somewhere, DevOps has also made the culture of IT much better. We didn’t used to talk about, like, operations people being happy.
Putting the charts away and going back into the land of anecdotes, there’s a lot of work to be done when it comes to improving deployment frequency and over all improving how software is done. Again, things have improved, but not, like, for 100% of organizations, developers, and so forth. Or probably even 50% or 60%.
Also, it’s worth noting that we often forget how much has improved. I forget what bias it is, but a few years after a system improves, people reset their baseline for bad. You know: airline travel sucks, but we forget that traveling by horse is incalculably worse.
Reverting to yaml mean
As you probably recall, dear readers, my other theory is that we can’t help ourselves when it comes to maintaining focus on the application layer, “developers.”
Every five or so years we have to dive down the stack and mess with the infrastructure layer, halting our work on making things better for developers. That work is not only halted, it’s usually tossed aside. Most recently, we did this with Kubernetes. That layer itself is totally fine…great, even for what it does, standardizing infrastructure over cloud (native) stacks: an API and data structure; configuration, release, and operational models; and even application architecture.
But the overall ecosystem (vendors and end-users) got too obsessed with Kubernetes, despite plenty of pleading not to by the the Kubernetes sages. The dog that caught the bus, etc. And we’re still too obsessed. Hopefully, it’s lessoning as it dawns on everyone that getting better at software means paying attention to the application layer and developer productivity.
Something like 50% of surveyed organizations can deploy their apps monthly or less. That number is probably less for large, not tech companies. Even if that’s 40%, even 30%, that number is great compared to what it probably was back in 2009. Let’s keep up the work to get the rest of them fixed up.

Upcoming
Talks I’ll be giving, things I’ll be doing, places I’ll be going.
June 28th, July 4th, July 11th Cloud Native for Financial Services talk series.August 21st to 24th SpringOne & VMware Explore US, in Las Vegas. Sep 6th to 7th DevOpsDays Des Moines, speaking. Sep 18th to 19th SHIFT in Zadar.
Logoff
This DevOps question is a little unfair in that it can seem like it’s precise. I mean, it’s just some charts and trying to make sense of them. If we had all of the years of DORA charts with the deployment frequency and other characteristics over time, I think that’d be the best. Perhaps that exists! But I didn’t look long enough to find them. Tell me what you think, and see y’all next time.


